Desert Bloom Dynamics
Description
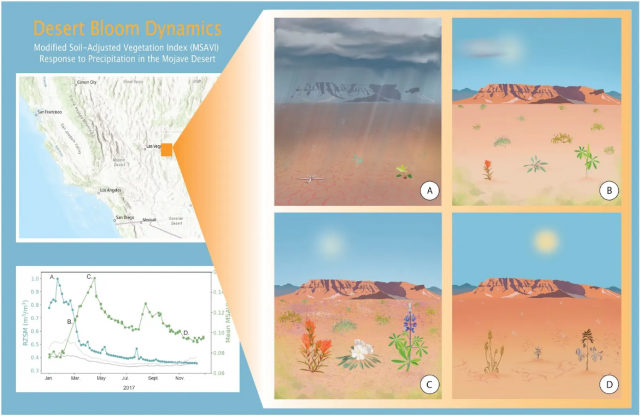
Desert Bloom Dynamics
This illustration shows how desert plants respond to changing rainfall. Using satellite data, the MSAVI index reveals how vegetation grows—or struggles—across wet years and droughts, helping scientists track the Mojave’s resilience in a shifting climate.
This illustration blends art and satellite science to show how native desert wildflowers—Desert Paintbrush, Birdcage Evening Primrose, and Silvery Lupine—grow, bloom, and die during a wet year in Parashant National Monument. The graph shows vegetation response over time using the Modified Soil-Adjusted Vegetation Index (MSAVI), a tool that tracks plant health from space. Each panel (A–D) corresponds to a key moment in the plant life cycle—starting with a wet season and ending in dry heat—highlighting how desert ecosystems flourish briefly, then fade. Scientists use satellite-based vegetation indices like MSAVI to better understand how drought and rainfall shape life in arid landscapes.