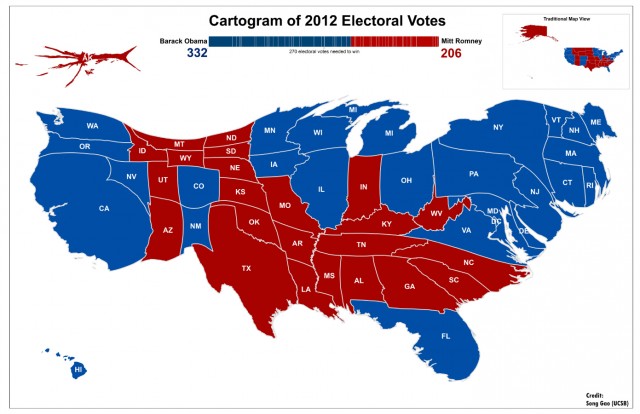
Cartogram of 2012 Electoral Votes
Description
A cartogram is a map of art in which some thematic mapping variable, such as population socioeconomic factors, is substituted for land area. The geometric space of the map is distorted in order to highlight the objective variable, as is clear to the eye. Here we show an example of the 2012 U.S. Presidential Election results based on the electoral votes by state, which illustrates the relative sizes of the votes by scaling the area of each state in proportion to its electoral population. Such cartogram is a better visual representation of election results compared to traditional map view since a large state by land area is not necessary meant to have large electoral votes. The cartogram clearly tell the public audience the real importance of state in the election at the first sight, in terms of the count of electoral votes. Note that the distortion of some states boundaries, e.g. the noticeably enlarging Pennsylvania and the shrinking Alaska.